About reports
What the 17 reports cover, how they are grouped, which controls each one has, and which report answers which question about your business.
The short answer
- Reports in the sidebar lists all 17 reports in six groups, with a search box. It needs money access.
- Most reports cover a period and open on This year. Four show your stock as it is right now.
- The controls differ from report to report. The table below says which report has which.
- The ledger reports (Profit & Loss, Sales vs Expenditure, Schedule C (COGS), Profit dashboard) are net of returns and count a sale on its ship date. The order reports (Orders Margin, Orders by category, Product Leaderboard) file sales by order date and show their money as it was when each order was fulfilled, before returns.
The Reports page and its search
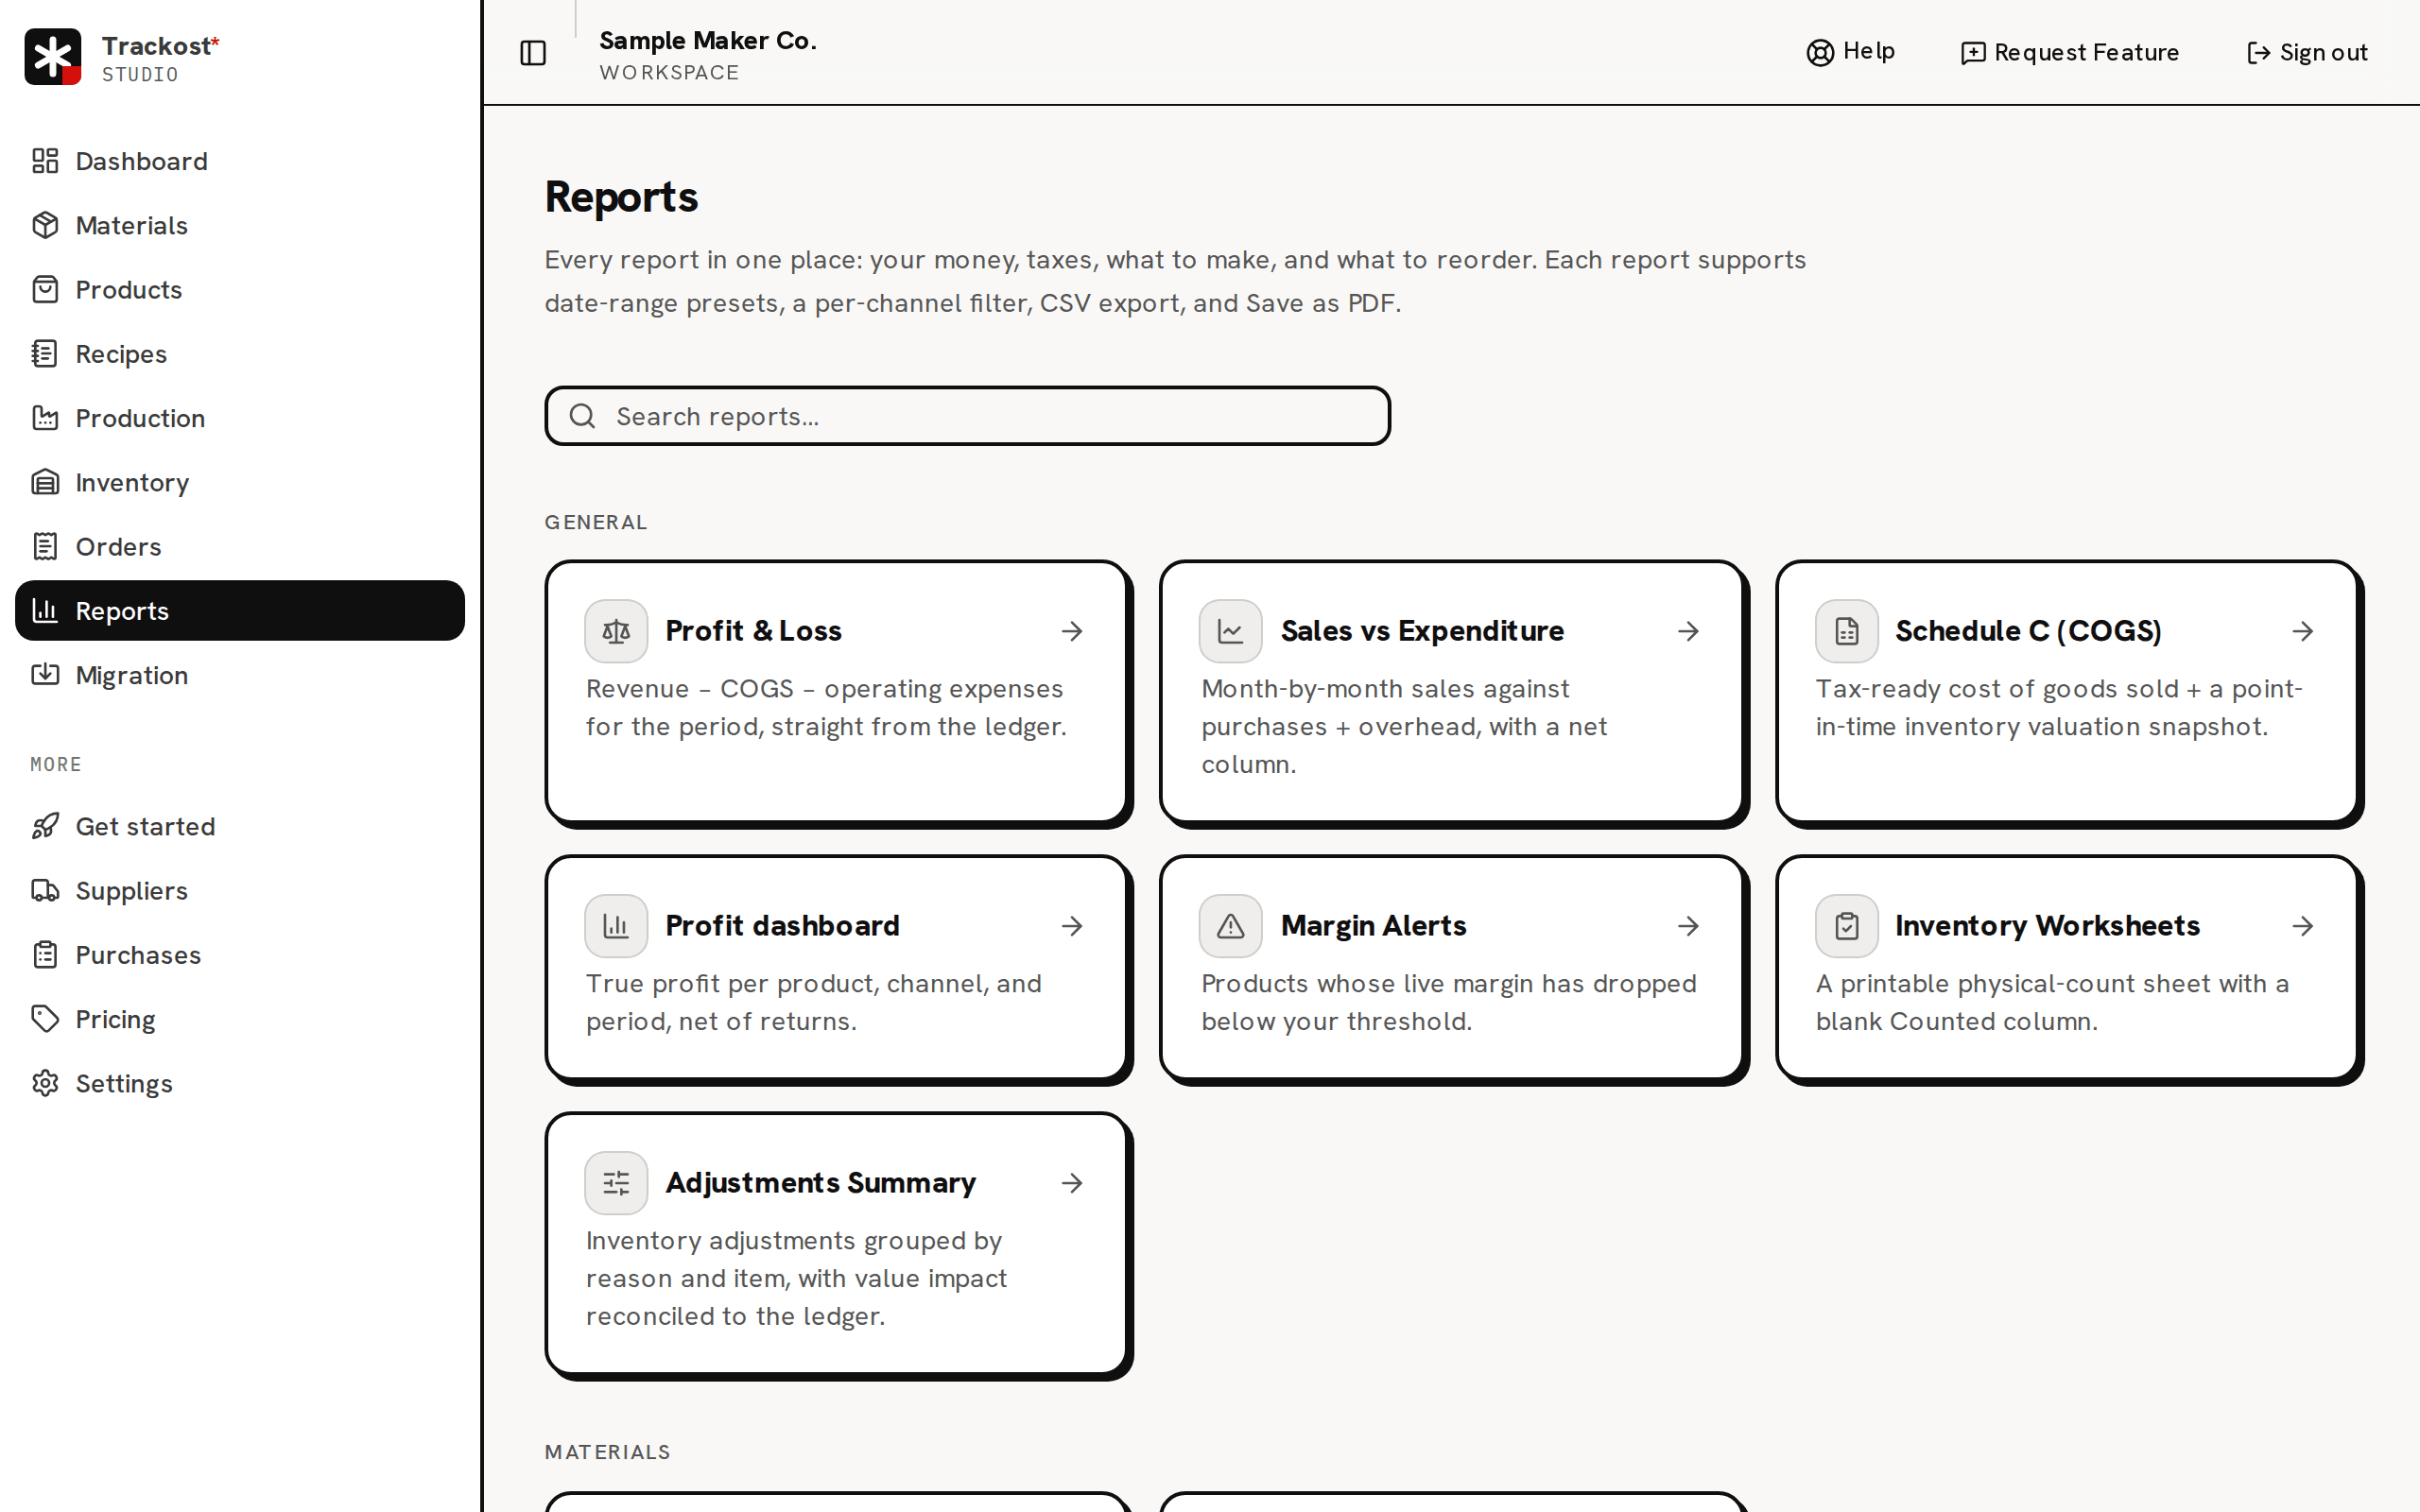
Click Reports in the sidebar. Each report is a card with a line on what it shows; click a card to open the report.
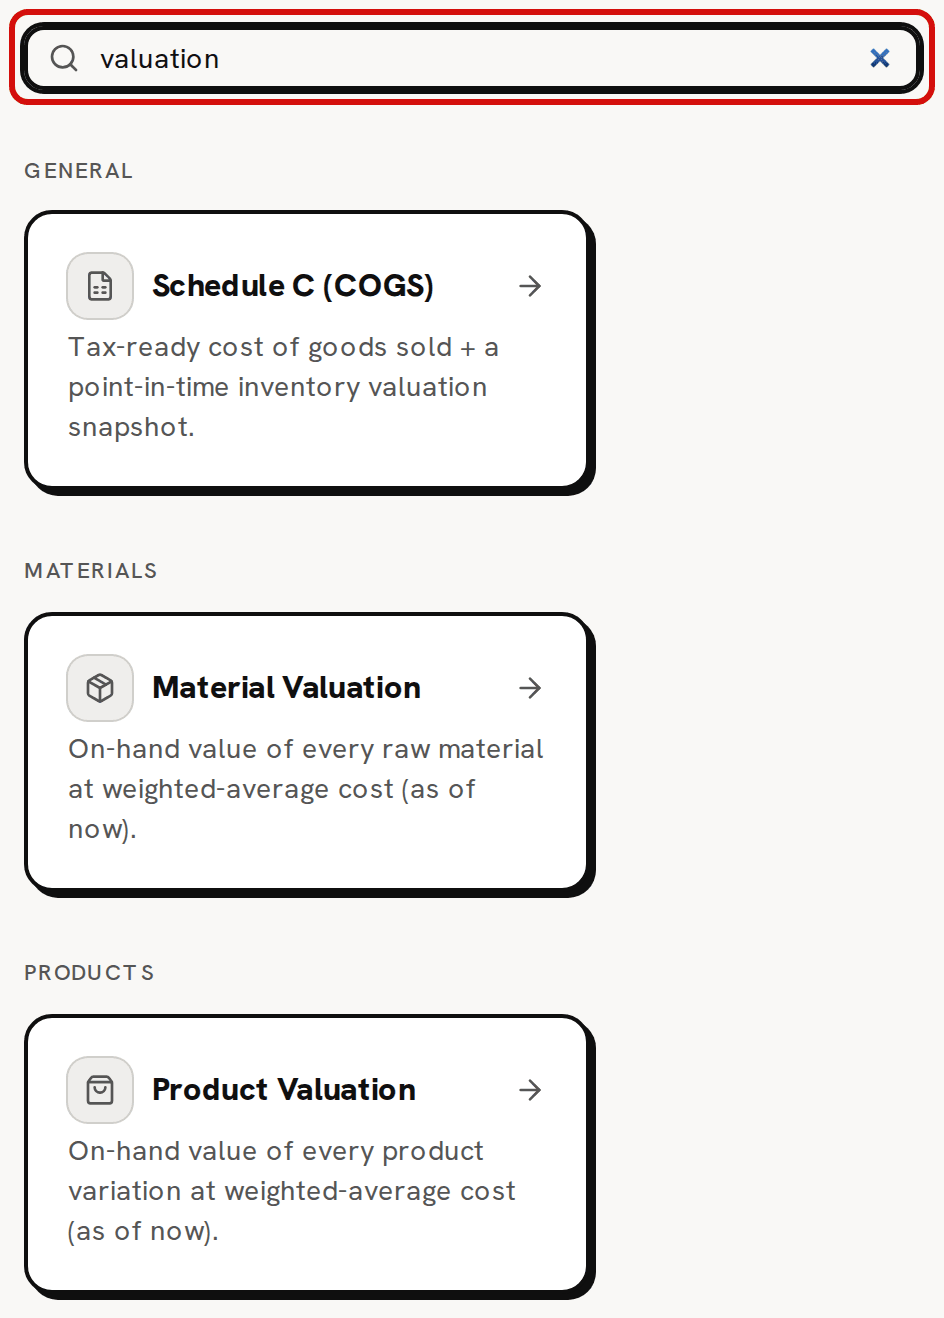
Type in Search reports… to narrow the cards. A report stays when every word you type is in its title, its line or its group. Delete what you typed to see every card again. When nothing matches, the page says so and offers Clear.
The six groups
- General: Profit & Loss, Sales vs Expenditure, Schedule C (COGS), Profit dashboard, Margin Alerts, Inventory Worksheets and Adjustments Summary.
- Materials: Material Valuation and Material Reorder.
- Products: Product Valuation and Product Leaderboard.
- Orders: Orders Summary, Orders Margin and Orders by category.
- Purchases: Purchases by category.
- Manufactures: Manufacture Summary and Manufacture Picklist.
Period reports and right-now reports
A period report shows what happened between two dates. Pick the period from the presets at the top: This month, Last month, This quarter, This year, Last year, Last 30 days, Last 90 days and All time. Every period report opens on This year. The presets follow the calendar in UTC. There is no date picker on the reports.
Material Valuation, Product Valuation, Material Reorder and Inventory Worksheets show your stock as it is now, with an 'As of' date. They work it out again each time you open them, and keep no history, so there is no way to see what your stock was worth on an earlier day. To keep a year-end value, download or print them on the last day of the year.
What each report offers
The line at the top of the Reports page says every report has date presets, a channel filter, CSV export and Save as PDF. Several don't. This is what each one has:
| Report | Dates | Channel filter | CSV | Save as PDF |
|---|---|---|---|---|
| Profit & Loss | Presets | Yes | Export CSV | Yes |
| Sales vs Expenditure | Presets | Yes | Export CSV | Yes |
| Schedule C (COGS) | This year or last year | No | Products, Materials and Orders CSV | No |
| Profit dashboard | All time only | No (it can group by channel) | Products, Materials and Orders CSV | No |
| Margin Alerts | Right now, with a 20%, 30% or 40% threshold | No | No | No |
| Inventory Worksheets | Right now | No | Export CSV | Yes |
| Adjustments Summary | Presets | No | Export CSV | Yes |
| Material Valuation | Right now | No | Export CSV | Yes |
| Material Reorder | Right now | No | Export CSV | Yes |
| Product Valuation | Right now | No | Export CSV | Yes |
| Product Leaderboard | Presets | Yes | Export CSV | Yes |
| Orders Summary | Presets | Yes | Export CSV | Yes |
| Orders Margin | Presets | Yes | Export CSV | Yes |
| Orders by category | Presets | Yes | Export CSV | Yes |
| Purchases by category | Presets | No | Export CSV | Yes |
| Manufacture Summary | Presets | No | Export CSV | Yes |
| Manufacture Picklist | None: a recipe and a quantity | No | Export CSV, once the list shows | Yes |
The channel filter offers All channels, Manual for the orders you entered, and each connected shop. Connecting a sales channel (Shopify, Etsy or Faire) isn't covered in this help center yet. Email support@trackost.com and we'll walk you through it.
Save as PDF opens your browser's print window, where you print or save the report as a PDF. It prints the report without the menus. A report without the button can still be printed from the browser's own menu. The sidebar and top bar never print; the page's title, description and its own buttons do.
Manufacture Picklist shows nothing when it opens, even though its recipe box already shows a recipe. Pick a different recipe, or type a quantity and click outside the box, and the list appears.
Ledger reports and order reports
Some reports read your ledger, the record Trackost keeps of every movement of stock and money. Others read your orders.
- Profit & Loss, Sales vs Expenditure, Schedule C (COGS) and the Profit dashboard read the ledger. A sale counts on its ship date, a purchase on its purchase date, and a return on the day you record it, which takes it off again. They are net of returns.
- Orders Summary, Orders Margin, Orders by category and Product Leaderboard read your orders and file each one by its order date. Their money figures are the ones each order got when you fulfilled it, so a later return doesn't change them. Product Leaderboard does take returned units off its unit count. Orders Summary counts every order you entered, fulfilled or not. Orders Margin shows '—' for the COGS and profit of an order that isn't fulfilled yet. Product Leaderboard and Orders by category count an open order's revenue but have no cost for it yet. A product or category that also has shipped orders shows a profit and margin that are too high until the open ones ship, and one with only open orders shows '—' for its COGS, profit and margin.
So after a return, Orders Margin and the Profit dashboard no longer agree. Orders Margin shows the sale as it was fulfilled, and the Profit dashboard shows it less the return.
A return without restock is counted differently by the Profit dashboard and Profit & Loss, and the two then disagree by the amount written off. Always say which report a profit figure came from. Record a customer return shows the two side by side.
Schedule C (COGS) covers a calendar year. Its Beginning inventory is always $0.00, its Beginning work in progress is the batches still in progress when the year began, and its Ending inventory is the value of your stock today, whichever year you view.
Who can see reports?
Only members with money access. For anyone else, Reports is not in the sidebar and the reports that show money say 'Money access required'. Three reports carry no money and open for every member who has the link: Material Reorder, Inventory Worksheets and Manufacture Picklist.
If your trial or plan has ended, your CSV downloads keep working. About your 14-day trial lists their addresses.
Which report answers which question?
- How much did I make this year? Profit & Loss, on This year.
- Which products make me the most? Profit dashboard, grouped by product, or Product Leaderboard.
- Which orders made the least? Orders Margin.
- What is my stock worth right now, or at year end? Material Valuation and Product Valuation, on the day you need the value.
- What goes on my tax return's cost of goods sold? Schedule C (COGS), checked with your accountant.
- What do I need to reorder? Material Reorder.
- What do I pull from the shelf for a batch? Manufacture Picklist.
- Which prices no longer leave me enough margin? Margin Alerts.